
It’s time for an upgrade!
We are rolling out a ton of new features, all for your analytical pleasure. Our analytics platform is now more powerful than ever. All the new bells and whistles will give you key insights into how your customers are responding to your campaigns, allow you to more accurately target your audience, and ultimately, maximize your marketing dollars.
Now, you can track and compare the success of your campaigns through top level statistics and demographic data that is based on language, device and location. You can even drill down to the specific user activity to identify who on your list is the most active.
Let’s break it down
Our intricate analytics platform has two modes – normal and comparative. In normal mode you can focus in on a single time period. In comparative mode you can compare all events, demographic data, top scratch-its and top users
Segment Selector
The segment selector gives you a closer look at specific Scratch-it campaigns or time periods. The detailed analysis of your selection will show you how successful you were with a specific scratch-it or over a specific time frame. This comes in handy for when you want to compare offers and campaigns against one another.

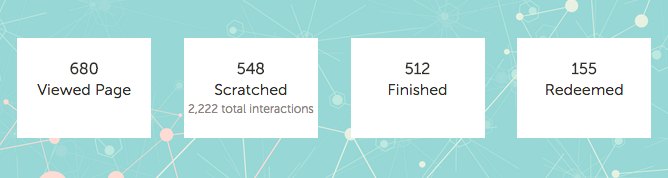
Top Level Data
These top level statistics provide insight into how your Scratch-it campaigns are getting users to convert. The four boxes at the top of the analytics dashboard will give you a good snapshot of the overall success of your campaign. From landing on the Scratching page to hitting the redeem button these stats explain the complete user experience.
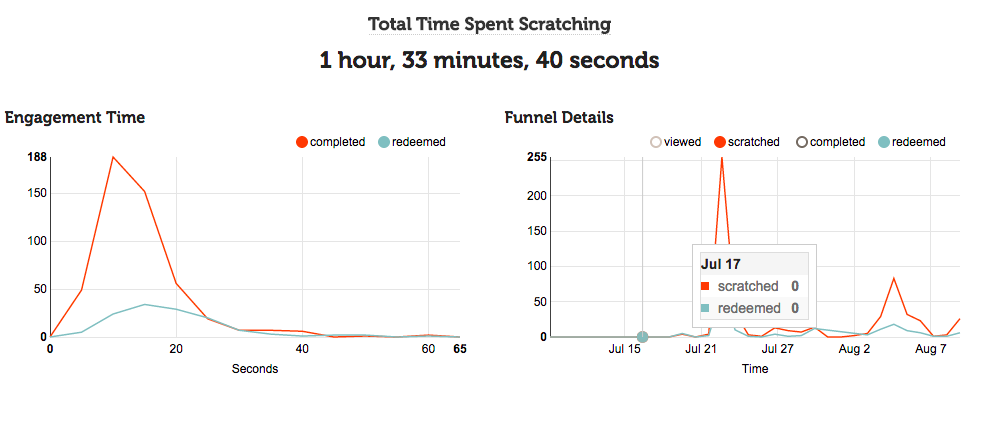
Total Time Spent Scratching
This statistic shows the total time your customers have engaged with your Scratch-it campaigns. This data lets your team put a finger on how engaged your audience is with your content.
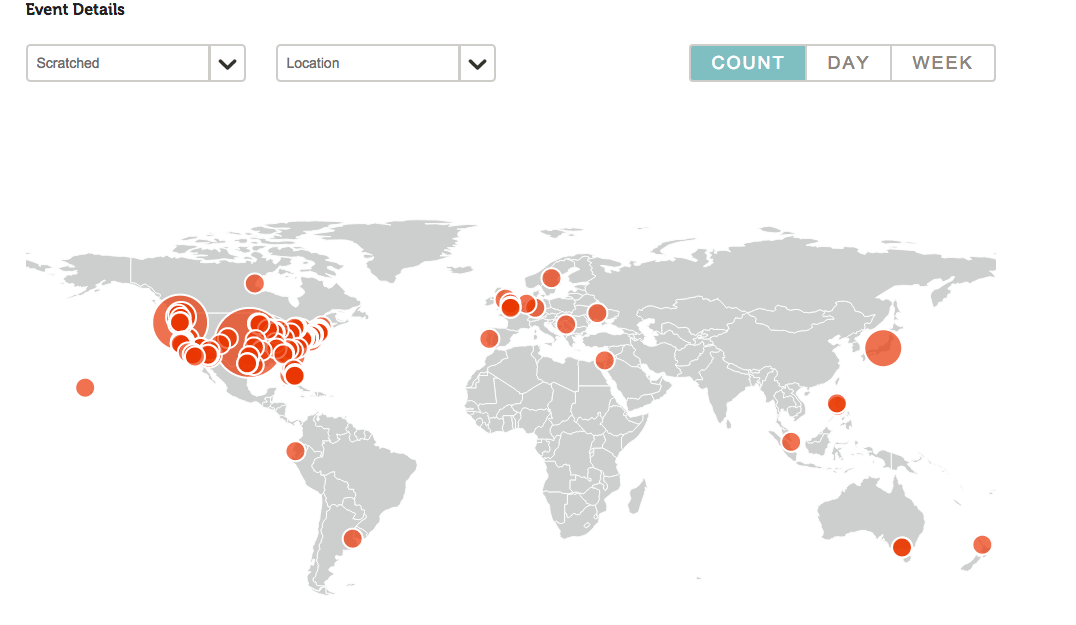
Event Details
What’s great about interactive content is how easy it is to drill down by each activity. When someone interacts with a Scratch-it there are four events that can be triggered – Page Views, Started Scratching, Completed Scratching, and Redeem. We take a record of every time one of these activities were triggered, each time they were triggered, and who triggered them. This is incredibly powerful as it allows us to really determine the effectiveness of the offer of your Scratch-it down to the specific event.

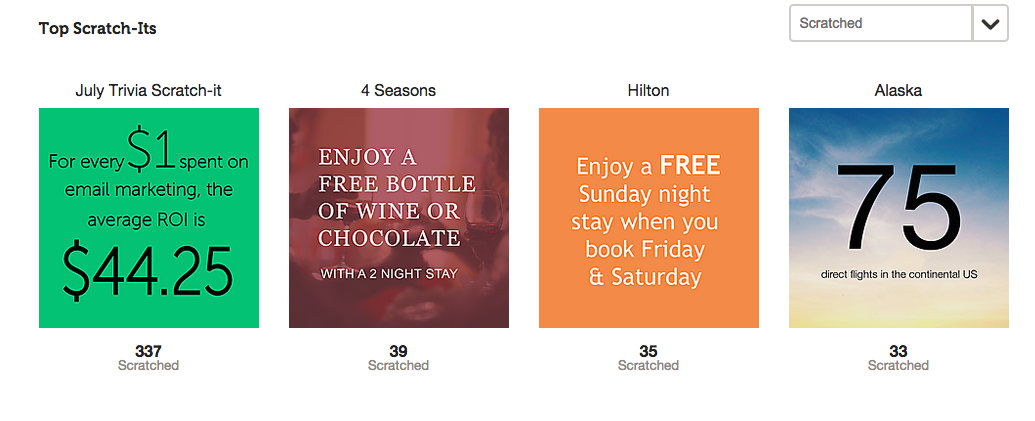
Top Scratch-its
This is the place your very best performing Scratch-its are organized. In this section you are able to identify which Scratch-it campaigns had the most success.

Top Users
Much like the top Scratch-its section, this list shows you your most engaged users. You can then export this data and use it to create a list for better performing campaigns across all channels as well as provide insights into who is most likely to buy in future Scratch-it campaigns.
With all these new features, your Scratch-it campaigns just got a whole lot more valuable. If you have questions or would like to learn more please reach out to info@scratch-it.com with ‘Analytics’ in the subject line.